Hyperdigititis – A pandemic for our times

Presenting numbers with excessive and artifical precision in product labels, newspaper articles and report tables does nothing for scientific credibility and sows confusion in the mind of the reader.

GARRISON Keillor’s book Lake Wobegon Days states that “The lake is 678.2 acres, a little more than a section…” To me this is a master-stroke, providing corroborating detail that produces utter belief in the reader.

In contrast, a science-fiction novel about exploring a new planet in a home-made zeppelin claims that a crew member cried out, “Captain! That mountain must be at least five thousand five hundred and forty five meters high!”

This paragraph stopped my reading dead in its tracks (to mix a metaphor). I guarantee that no entity, in this galaxy or anywhere in the universe, has ever gurgled or telepathed that “The mountain must be at least 5,545 glugs high!”

Obviously the original American edition said the mountain was “at least three miles high”, then the task of converting to metric values was given to the publisher’s idiot nephew who didn’t know enough to change “at least three miles” into “at least five kilometres”. Instead he relied blindly on the output of his hand calculator. Readers who know that visual measurement of distance is imprecise, cannot be bamboozled. Overly precise numbers can be a source of amusement but all too often are a form of spin-doctoring. Commercial organisations are especially prone to report excessively precise numbers that pretend to an impossible degree of accuracy. I propose the term, ‘hyperdigititis’ to describe such pseudo-scientific nonsense.

Under what circumstances do we accept improbably precise values, and when do we reject them? I suspect one important factor is whether we ourselves can estimate whatever is being measured, as opposed to invisible values only measurable by a white-coated scientist. Invisible units are typically over-specified whereas visible units are rounded to sensible values.

Example 1

Excessive digits act as barriers to readers’ understanding. Table 1 is an example from a (name-protected) agricultural report.

Treatment Raw yield % Sugar
Chemical A 43.080 15.230
Chemical B 29.800 12.200
Chemical C 44.880 15.560
Untreated Mean 43.610 15.985
LSD .05 8.575 1.447
CV 15.25% 7.70%
Table 1. Excessive digits in an agricultural report.

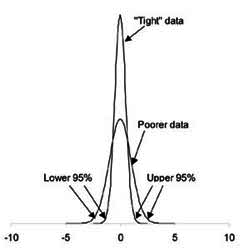
A brief explanation is needed here: The LSD or Least Significant Difference indicates how far apart two averages must be in order to conclude that they differ significantly with 95 percent confidence. The CV or Coefficient of Variation measures the variability of a measurement, in this case about 15 percent for yield and eight percent for sugar percentage. An important lesson here is that all biological data has at least five percent variability.

The table above demonstrates an all too common misuse of numbers, to convince us that the authors are incredibly precise, rather than to present useful information. The large degree of uncertainty (LSD and CV) shows that none of the digits to the right of the decimal point are valid. That even applies to the LSD itself, since the LSD also has a certain amount of uncertainty.

So the figures ought to be as in Table 2.

Treatment Raw yield % Sugar
Chemical A 43 15
Chemical B 30 12
Chemical C 45 16
Untreated Mean 44 16
LSD .05 8.6 1.5
CV 15% 8%
Table 2. The same report figures with adjusted digits.

I think you’ll agree with me that the second version is much easier to understand, showing that Chemical B lowered yields but chemicals A and C had no effect.

Example 2

I once had to compile comprehensive tables of animal feed-stuff compositions. Published reports usually had three-decimal precision, eg, “4.35% arginine”. Never mind that analyses of different samples showed coefficients of variability up to 19 percent.

Enormous tables showing 17 amino acids with three-decimal accuracy are bulky and impossible to understand. By dropping the unjustifiable precision, these tables became smaller and quite readable. After all, the readers of that report were mainly animal feed formulators, who probably don’t want to know more than low, medium, or high. I was able to inform them that six independent analyses of, say, methionine in wheat, showed a low of 0.10, mean 0.17, maximum 0.22.

Example 3

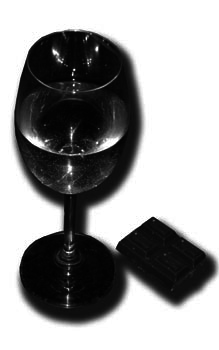
On 22 April 2009, the Christchurch Press published a beautifully illustrated half page to show that alcoholic beverages are energy-rich. This article inadvertently demonstrated the difference between invisible kilojoules and visible foods (blocks of chocolate).

The article claimed that one glass of wine contains 390 kJ, gin-and-tonic 400 kJ, and a shot of Baileys 408 kJ. (In addition, a pint of beer was measured, with incredible precision, as 1098 kJ.) Some credulous readers might have switched to drinking wine instead of Baileys, yet the published values were basically meaningless!

The energy value of wine depends on whether it’s red or white, dry or sweet. According to the November 2006 issue of Healthy Food, the energy value of 100 ml of white wine is between 345 and 395 kJ, while red wine is 340-365 kJ (www.healthyfood.co.nz/articles/2006/november/how-many-kjs-are-you-drinking).

Those figures are based on a ‘standard’ 100 ml serving of wine, rather than the 135 ml servings proclaimed on wine bottles (5.6 servings from 750 ml). Don’t bother working out ratios, unless you are prepared to measure out beverages to three-place accuracy.

The real conclusion, entirely missed by the newspaper, is that a typical alcoholic drink has about 400 kJ regardless of whether it’s wine or spirits.

In stark contrast to the hyperdigitised kilojoule values, the article states that each drink is equivalent in fattening power to half a block of chocolate. Not 0.48 of a block! When the measurement involved something we can see for ourselves, the journalist automatically rounded correctly.

Example 4

The consumer-food industry, world-wide, seems determined to confuse consumers with food composition tables filled with excessive and unjustifiable detail. To fit all these digits in, the tables are often printed in tiny fonts. Even with large fonts, the length of numbers makes it difficult for shoppers. Processing “12.34” requires more than double the effort to handle “12”. (The decimal point is part of the problem.) I believe that hyperdigitised numbers are misleading because 1) they claim accuracy that is not there; 2) the analytical methods employed provide only approximations to the food components purportedly measured.

Almost all food labels disregard biological variability, which is typically at least five percent. Other than near-pure chemicals like sugar and salt, most prepared foods are made from plants and animals that have different histories. What cultivar of wheat was used? Was the beef from a Friesian cow or another breed? What region? What soil type? Irrigated or dry-land? Many food labels state, with admirable honesty, that they represent indicative values based on averages. Unfortunately that doesn’t mean any reduction in unjustifiable precision. My candidate for worst offender is a packet of delicious Vietnamese snacks, the label of which proclaims that sodium per biscuit is 14.22 mg. Western food manufacturers are not much better.

Table 3 shows part of a Nutrition Information table from a tin of imported luncheon meat:

Component Per 56 g serve (sic) Per 100 g
Energy (kJ) 610 1089
Energy (Cal) 145 259
Protein (g) 5.0 8.9
Fat, total (g) 12.0 21.4
Carbohydrate, total (g) 4.2 7.5
Table 3. Luncheon meat nutrition information.

Let me put energy values aside for just a moment, except to note that the calculated “259 Cal/100g” was almost surely provided by the same idiot nephew who worked on the science-fiction novel cited at the beginning of this article. Multiplying a value that is accurate to two places by a factor that is accurate to three or more places, does not provide a three-place result.

Protein

The standard way to measure protein is to digest foodstuff in boiling sulphuric acid (Kjeldahl analysis). This converts all nitrogenous chemicals into ammonia. The liberated ammonia is measured and that value multiplied by 6.25 is reported as “crude protein”. Unfortunately, the correct multiplier depends on what’s being analysed. Factors as low as 5.71 and as high as 7.69 may apply. (Hint: the factor is the inverse of the percentage N, which in turn is related to the amino acid composition of each protein.)

Many non-protein chemicals are converted to ammonia during the Kjeldahl procedure. That includes not only alkaloids and free amino acids, but also man-made chemicals like melamine. In any effort to improve precision of protein analysis, an erudite committee of nutritionists has recommended that proteins should be hydrolysed gently, so that individual amino acids can be measured. That route is not only more expensive than digestion but also opens a Pandora’s box of complexity, because all proteins are not created equal. Proteins with lysine, methionine and perhaps threonine are more valuable for growing animals than other proteins. Do we need another data entry on the Nutritional Contents tables showing relative protein values for children as opposed to adults?

With all these uncertainties about protein analysis, even a two-digit claim of “8.9 g protein” seems unjustifiable. Who needs such precision? A nutritionist who relied on these numbers to formulate a patient’s diet could be grossly misled. Consumers mostly need rough indications that a food is low, medium or high protein.

Carbohydrates

The FAO says that total carbohydrate can be estimated by difference, that is, everything left over once protein, fat, water, ash, and alcohol are subtracted. This is a friendly touch from the FAO. It allows ‘carbohydrate’ values that include fibre (polymeric carbohydrates) and organic acids.

Carbohydrates can be either soluble or insoluble, with starch the major insoluble material. If we consider only insoluble material, mostly it’s starch and ‘fibre’. Generally only starch is available for our nutrition, and then only after cooking, although heat may convert up to eight percent of total starch into indigestible ‘resistant starch’.

Soluble carbohydrates include small sugars as well as oligosaccharides, such as fructose-containing material from onions and artichokes. The latter are not utilised by the human body but rather by micro-organisms residing in our gut. Clearly, a simple chemical result of “7.5 g carbohydrate” is only a rough approximation to digestible carbohydrate.

Fat

For a change, measurement of fat as lipid-soluble material is straightforward. I’m not aware of any technical problems with estimates of saturated versus unsaturated fats. There are some issues about how mixtures of fats may not have the same digestibility as pure fats.

Energy

Strictly speaking, energy content should be measured by combustion of a sample of food, with another food sample being fed to someone who is willing to collect all his bodily excretions for the next day or so. Such volunteers are hard to find. Even the feedstuff people rarely use animal feeding studies, because they have equations that convert individual components into an estimate of digestible energy. For poultry, the formula is 0.34% x Fat + 0.16% x Protein + 0.13% x Sugars. It’s obvious that any errors in measurement of fat, protein or sugar will affect the final energy values.

For people, similar formulas are available with ‘Atwater’ factors. There is a ‘general’ Atwater table and a ‘Specific’ table that tries to compensate for different ingredients. There’s only a two percent difference when animal-based food values are crunched through the Atwater methods. For wheat flour the discrepancy is seven percent and for cabbage or snap beans 20 percent. How, then, can a claim of “1089 kJ” be justified for a food made from a mixture of ingredients?

My suggested version

In view of all the uncertainties, I’d suggest a major simplification of nutritional information tables. Shorter numbers would be comprehensible and readable, while the present over-long numbers are mind-numbing rather than informative.

So Table 4 has my version of what I’d like to see on the luncheon meat container:

Component Per 56 g serve Per 100 g
Energy (kJ) 60 1100
Energy (Cal) 150 250
Protein (g) 5 9
Fat, total (g) 12 21
Carbohydrate, total (g) 4 8
Table 4. Luncheon meat nutrition information, adjusted.

References

Mann, J. D. 1998: Feedstuffs of monogastric animals. NZ Institute for Crop and Food Research.

FAO “Methods of Food Analysiswww.fao.org/DOCREP/006/Y5022E/y5022e03.htm

Playing the numbers game

Some risks in life are distributed throughout a population, others are all-or-nothing. There’s a big difference. This article is based on a presentation to last year’s Skeptics Conference.

Many organisations, not excluding certain government agencies, rely heavily on public fear to influence public decisions and to provide their on-going funding. That provides strong motivation to generate fake fears even where there is no real public danger.

There are several methods in use:

  1. The distinction between evenly distributed risks versus all-or-nothing risk is obscured.
  2. Forecasts that should be written as fractions, are multiplied, unjustifiably, into a purported risk to individuals (“10 deaths per million”).
  3. An obscure statistical trick is used to treat the most extreme possibility as though it is the most likely.
  4. Numbers are reported with unjustifiable levels of precision to provide a reassuring air of scientific competency. A check of your foods cupboard will reveal boxes claiming, say, 798 mg of protein, where natural variations in ingredient composition can justify only “0.8 g”.

Kinds of risks

Imagine that a maniac injected a lethal dose of undetectable poison into one orange in a box of 1000 fruit. Would you willingly eat an orange from that box? Surely the risk of dying is more important than the minor pleasure of a juicy fruit.

On the other hand, assume that these 1000 fruits are converted into juice. Everyone who drinks a portion of juice will ingest one-thousandth of a lethal dose. Aside from the yuk-factor, would you drink this beverage? I would, since a dose of 0.001 of the lethal dose will not, in the absence of any other negative factors, harm me. A critical enzyme that is blocked by 0.1 percent will still provide 99.9 percent functionality. In fact, most enzyme systems are down-regulated (throttled back) by our natural feedback controls. We routinely consume significant but harmless amounts of natural poisons such as cyanide. Our bodies are rugged; we are not delicate mechanisms. We can function despite losing half our lungs, half our kidneys, most of our liver, and even parts of our brains. Most critical parts of metabolism are backed up by duplicate mechanisms. The key term here is ‘biological threshold’. To speak of a ‘low dose of poison’ is to mouth a meaningless collection of sounds: only high doses of poisons are poisonous. Evenly distributed risk versus all-or-nothing distribution

Returning to my example of the poisoned oranges, the risk factor is one in a thousand for an individual fruit and for a glass of juice. The difference between the two is that risk is lumped all-or-nothing in one case, and distributed uniformly in the other case. The maths may be the same but the practical conclusions are different.

Here is another example: the Bonus Bond Lottery. My $10 bond receives four percent interest a year, 40 cents annually, about three cents per month. Please don’t clutter my letter box with bank statements reporting another three cents! No Bonus Bond holder wants his or her earnings to be distributed uniformly. Obligingly, the bank turns all these tiny individual earnings into a single monthly prize of $300,000 going to just one lucky person. Three cents is trivial, but $300,000 is life-changing. No wonder people hold onto Bonus Bonds.

Injury from damaging chemicals or conditions is not random

The standard way to evaluate toxicity is to treat a number of animals with increasing amounts of chemical (or radiation, etc). The LD50 is the dosage where half the animals die (or develop cancer, etc.) Is the LD50 an example of all-or-nothing risk? In fact, it is a distributed risk applied over a heterogeneous population. All the animals given the LD50 dose were seriously ill but only half of them succumbed. Perhaps they had been fighting, or simply were genetically weaker. It’s hard to tell. Presumably the healthiest animals were most likely to survive.

Examine a lower dosage, where only 10 percent of the animals succumbed. The survivors didn’t go off to play golf! All were affected, but one in 10 was too weak to survive. If you imagine a bell-shaped curve where ‘health’ is on the x-axis, then a low dosage shifts all the animals to the left; those who started on the low-health side of the curve were likely to drop off the mortality cliff.

We can apply this logic to episodes of severe air pollution. We can predict, in advance, who is likely to die and who is likely to survive. There might be, say, 20 deaths per 100,000, but that does not mean an otherwise healthy man or woman has 20 chances in 100,000 of dying. It’s the people with pre-existing respiratory problems who are at risk, not everyone.

Groups that forecast a certain number of deaths per million, from a particular environmental contaminant, should be challenged to describe in advance the characteristics of the victims. Purported victims of tiny doses of chemicals will be abnormally inept at detoxification, perhaps because of liver disease. They are probably hypersensitive to many chemicals in addition to one particular man-made chemical. One may wonder how such people have survived to adulthood.

Turning 100 rats into millions of people

The rules for long-term testing of potential carcinogens are:

  1. 100 rodents per concentration (x 2 for both males and females).
  2. At least three dose levels.
  3. Highest dose levels such that animal growth is inhibited about five or 10 percent (ie, partly toxic doses).
  4. Lowest dose is one-tenth of highest. (Very narrow range).
  5. Attempt to minimise number of animals for both humanitarian and economic reasons (US$600,000 per study).

Successful experiments are those where, at high doses, death or cancer rates of 10 to 90 percent occur. For statistical and practical reasons, responses below 10 percent are difficult to measure. (A massive $3 million ‘mega-mouse’ effort failed to confirm a forecast of one percent cancer caused by low levels of a known carcinogen.) So estimates for risk at low doses can only be done by extrapolating high-dose results.

There are different ways to calculate hypothetical response to doses lower than tested. These are:

  • quadratic
  • linear
  • power
  • non-linear transition
  • threshold

Do we really care which extrapolation equation is used? Arguments between log-linear, probit, or threshold models are no better than discussions about whether the angels dancing on the head of a pin are doing the waltz or the two-step. It’s the unjustified extrapolation that’s at fault.

Remember, the number of rodents used is in the hundreds. Extrapolations give rise to predictions of, say, 0.001 cancers per 100 rats at a certain dosage. The meaning of this number is obscure. What is one-thousandth of a cancer?

Obedient computers, run by scientific spin doctors, multiply the numbers by 1000. So now the prediction is one cancer per 100,000 rats. Better yet, “10 cancers per million rats”, or perhaps “9.8 cancers per million”, to simulate spurious precision. We can now perform the brainless arithmetic of multiplying “10 per million” by the population of New Zealand, resulting in newspaper headlines of “40 cancer cases” per year. All this from fewer than one thousand rats!

Something is seriously wrong with this approach to toxicity testing. It predicts, with unjustifiable precision, death or cancer rates that are forever unverifiable. Moreover, high-dose tests can overwhelm natural defences, falsely suggesting damage from lower doses, damage that is never observed.

An alternative way to handle toxicological data is to see how long it takes for chronic doses to cause damage. An important paper by Raabe (1989) did this for both a chemical carcinogen and for radiation damage. His plots show, logically, that as the dosage was lowered, the animals survived longer. In fact, at low doses the animals died of old age!

Toxicologists using this approach could estimate “time-to-damage” with considerable reliability. (Converting rodent risk to human risk would remain problematical.) The results would be reported as, for example, “At this low dosage, our data predict onset of cancer in individuals with more than three centuries of exposure at the permitted level.” This kind of reassuring forecast would not, unfortunately, inspire larger budgets for the testing agency.

The ‘upper boundary scam’

The bell-shaped normal curve offers another way to fool the public. At the standard threshold of ’95 percent confidence level’, there is an upper limit point and a corresponding lower limit point. We expect the ‘real answer’ to lie between those points, but the most likely value is around the middle of the range. An honest report of our results should include both the mean (middle) value together with some indication of how broad our estimate is.

I have a homoeopathic weight-loss elixir to market. I have run simulated tests on 30 women using Resampling Statistics. (This is a low-budget business and I don’t want to waste my advertising budget on real experiments.) The mean result was, of course, zero change, but there was an upper-bound of 2 kg weight loss. (There was also a corresponding figure of minus 2 kg weight loss, ie, gain, but we won’t worry about that!).

Am I entitled to advertise ‘Lose up to 2 kg’? After all, 2 kg loss was a possibility, even though it’s right at the edge of statistical believability. My proposed advertisement is sharp practice, probably fraudulent. Surely no reputable organisation would distort their results this way!

Such considerations do not seem to bother US and NZ environmental agencies, which happily quote ‘upper bound’ forecasts. The US Environmental Protection Agency (EPA) wrote:

“We were quite certain any actual risk would not exceed that [upper bound] and would be a very conservative application and be quite protective. It does not necessarily have scientific basis, but rather a regulatory basis…. EPA considers the use of the upper 95 percentile as a conservative estimate.”

Problems

One problem with the upper bound estimate of risk is that the worse the underlying data, the more extreme the upper bound, and hence the greater the forecast risk! Some people might think this might motivate the EPA not to refine and expand its experimental database, but I couldn’t possibly comment.

There is nothing inherently wrong with using the upper bound; it does indeed offer reasonable confidence that no damage will occur. But it is dishonest if the central prediction, the mean (average) is not also given. The difference between the mean and the upper-bound tells the public whether or not the estimates are too crude to believe. Unfortunately both numbers are rarely given. One EPA spokesman stated that “The upper bound and maximum dose estimate is usually within two orders of magnitude” (my italics).

That’s an error margin of 100-fold!

A revealing example of how this works was given by EPA in a now-defunct web page devoted to estimating risks from chlorine residues in swimming pool water. That page seems to have been withdrawn, but my own copy of it is at www.saferfoods.co.nz/EPA_drinking_water.html

This amazing document considered the health risk if drinking water were contaminated by swimming pool water. The upper-bound risk was 24 bladder cancer cases per year (for the entire American population). Precautions against this happening would cost $701 million (note the convincing precision here). This would save $45 million of medical and other losses. Many people would have considered that such poor payback would be sufficient reason to drop the proposal.

The “24 cases” of bladder cancer represented the upper-bound estimate. The most likely estimate was, however, 0.2 cases per year. This agrees with their admission of 100-fold discrepancy between upper-bound and most-likely. The most likely outcome of spending $700 million would be to avert one case of bladder cancer every five years! Is that what EPA considers “conservative” and “protective”? Incidentally, the US has more than 60 thousand new cases of bladder cancer every year. An effective anti-smoking campaign would halve that number. What the EPA described as a “conservative” approach turns out to be a proposal to waste millions of dollars for little or no benefit.

There is a further consequence of the EPA mathematics. Since low doses of toxins can sometimes improve health (‘hormesis’), EPA’s figures imply a lower-bound estimate that two dozen cases of bladder cancer could be prevented by drinking dilute swimming pool water.

When the American Council on Science and Health petitioned the EPA to eliminate ‘junk science’ from its administrative process, EPA eventually announced that “Risk Assessment Guidelines are not statements of scientific fact … but merely statements of EPA policy.”

We might expect such behaviour from the EPA. After all, it has 18 thousand employees and a budget of more than US$6 billion. You don’t get that kind of money by telling the American public that they need not worry.

Meanwhile in NZ…

Surely our New Zealand government agencies won’t stoop to the dubious flim-flam of the EPA? Consider the NZ Ministry for the Environment report entitled in part, “Evaluation of the toxicity of dioxins … a health risk appraisal”.

www.mfe.govt.nz/publications/hazardous/dioxin-evaluation-feb01.pdf

“The current appraisal has estimated that the upper bound lifetime risk for background intake of dioxin-like compounds for the New Zealand population may exceed one additional cancer per 1000 individuals.

This cancer risk estimate is 100 times higher than the value of 1 in 100,000 often used in New Zealand to regulate carcinogenic exposure from environmental sources. Of course, if there were a threshold above current exposures the actual risks would be zero. Alternatively, they could lie in a range from zero to the estimate of 1 in 1000 or more.”

This confusing prose says, I think, that the likelihood of risk from dioxin-like compounds is much less than one per 1000. It might be zero, but the Ministry has not provided enough vitally important data. Should public policy be made on the basis of unlikely, unprovable, worst-case guestimates?

The upper boundary scam is, I believe, a despicable misapplication of ‘science’. It’s junk science. Should a government agency be allowed to misinterpret data in a way that would lead of a false-advertising claim if tried on by private merchandisers? I think not.

Our brains are not wired to handle low probabilities. We jump to conclusions on the basis of inadequate information. It’s in our genes. Cave men or women who waited around for more information were eaten by sabre-tooth tigers and didn’t pass their cautionary genes on to us. The cave woman who ran at the slightest unusual sound or smell passed her quick-to-act genes on to us. This is not a good recipe for evaluating subtle statistical issues.

In today’s world, there are many people and organisations ready to push their narrow point of view. We need to be as suspicious about groups claiming to ‘protect’ us or the Earth as we are about time-share salesmen and politicians.

A small success story

Just once in a while, speaking up can make a difference.

As I entered my favourite local pharmacy, I was disturbed to read a sign on the window announcing that a certain iridologist would be holding consultations at this shop at a future date. I asked the pharmacist if he really felt this was helping the community or his image. He asked what the problem was. I said that I had to rely on his professional expertise for assistance in choosing between competing products, and his promotion of iridology would make me (and others) dubious about his professional judgment. I’m afraid I described the field of iridology with some strong epithets, moderated only by the presence of female assistants and shoppers.

After promising him more factual information, I went home and dug out the Truth Kit on Iridology prepared by Dr John Welch a few years ago. I left this with the chemist, promising him that he’d be unhappy when reading it. My expectations were minimal, for I’d also noted an ad in a local oldfolks publication promising that this pharmacy regularly had visits from the iridologist. There was clearly some degree of commitment by the pharmacy.

To my utter surprise, on a later visit to the shop, the Truth Kit was returned with a comment that the iridologist would not be returning again. The pharmacist had not stopped with the truth kit, but had (very properly) obtained an independent opinion about iridology. We agreed that a ‘discipline’ purporting to diagnose illness, that would misdiagnose nonexistent problems while missing actual disorders, was not acceptable.

This was my first success in modifying a misleading action by a chemist shop. I’ve had total failures: another chemist was selling oxygenated vitamin water, and my protestations that these claims were nonsense were met by the statement that “many people think it’s very powerful”. Success was due to the fact that iridology makes specific claims for efficacy and accuracy, and these claims had been demolished by the Truth Kit.

Most health products are sold with no real claim to do anything. The labels will say, for example, “This plant is traditionally used to treat xxxx,” or “This product supports liver/heart/circulation/brain function”. Cleverly worded but meaningless statements like this are neither provable nor disprovable.

On the other hand, it’s not the job of skeptics to stop people from wasting their money on magic water or enchanted inositol pills. (If that is our self-appointed task, perhaps we should start by investigating the claims of financial advisers compared with their actual results.)

Bruce Ames: Environmental Prophet or Apostate?

What is the link between chemicals and cancer?

Forty years ago, Bruce Ames was a young microbiologist working at NIH in the day and enjoying Scottish country dancing in the evening, when he had an inspiration: to use the rapid growth of bacteria as a method for determining whether a particular chemical was able to cause mutations. If the chemical was positive — i.e., was mutagenic — it might be considered as a possible cause of cancer. This method, soon called “the Ames test”, became widely used. It was cheap, fast, and sensitive. One of the first discoveries was that a dye commonly used in children’s pyjamas had mutagenic properties. Bruce Ames became a hero to the environmental movement when he led a successful campaign to ban such dyes.

Ames was more interested in reducing the death toll from cancer than he was in attacking new chemical technology. As more results from the Ames test accumulated, he realised that many naturally occurring chemicals were also giving positive results. Even more disturbing, the number of chemicals that seemed to be positive in high-dose tests on mice and rats was, he felt, excessive. In an extensive series of important reviews, published in prestigious journals such as Science and Proceedings of the National Academy of Sciences, he has attempted a quantitative estimate of the difference in human cancer. Because his figures show manmade chemicals in food and the environment to be quite insignificant compared to natural or self-inflicted factors, the name of Bruce Ames is now anathema to the same environmental movement that once applauded him. Nevertheless many professional scientists believe that Ames’ position is basically correct. If the inventor of the Ames test now says that most methods for detecting carcinogenicity are invalid, it is certainly not a case of sour grapes. This article is an attempt to summarise his beliefs. Those who are sufficiently interested should read some of the papers listed in the bibliography.

(1) What do we know about the incidence of cancer?

First, cancer risk increases according to the 5th power of age. That is, a 40-year-old is 100,000 times more likely to be cancerous than a 20-year-old. There are more cancer cases per 100,000 population simply because we are living longer and no longer dying of infectious diseases.

Second, the age-corrected mortality (death rate) from cancer has been declining since 1950 except in those over 84. Overall decline has been 13%. Naturally much of this decline is caused by improved detection and treatment. The only exceptions are lung and skin cancer, clearly caused by tobacco smoking and by increased exposure to sunlight. There are occasional claims that certain types of cancer are increasing slightly, but improved methods for detection are probably responsible.

Thirdly, some mostly unknown environmental factors have a major influence on the types of cancers that are likely. Japanese, for instance, have a high incidence of stomach cancer, yet Americans and Japanese-Americans have a low incidence. On the other hand, American men have much more likelihood of prostate cancer than do Japanese.

(2) What are the major known causal factors in cancer?

The single most important factor is smoking. This accounts for one-third of all US cancer deaths, not to mention one-fourth of heart disease. Each year, smoking causes 400,000 premature deaths in the US and 3 million deaths around the world.

Chronic infections contribute to about one-third of cancer on a world- wide basis. As mentioned below, any factor that causes body cells to divide increases the likelihood of cancer. Hepatitis B and C infect 500 million people, mainly in Asia and Africa. This liver infection is a major cause of “hepatocellular carcinoma”. Two different Schistosomiasis worms infect Chinese colons and Egyptian bladders, being associated with increased cancer risk in those two organs. Liver flukes cause chronic inflammation of the biliary tract, hence risk of cholangiocarcinoma. A bacterium, Helicobacter pylori, is adapted to living in the human stomach and is now believed to be a major cause of stomach cancer, ulcers and gastritis. (So much for the classical psychogenic explanation for ulcers!)

Overall about 70% of cancers might be caused by environmental factors, but pinpointing the exact causes is very difficult. There remains some 30% that cannot be ascribed to any factor other than age and bad luck.

(3) How does cancer develop?

The first requirement is that a dividing cell suffer some sort of damage to its DNA. (DNA is the basic material of our genes.) DNA damage occurs all the time, but our bodies have excellent repair mechanisms to detect and destroy damaged DNA. Based on the amount of DNA breakdown products in the urine, Ames and co-workers estimate about 10,000 “hits” on DNA every single day in an adult. These repair mechanisms are not 100% perfect, and some damaged DNA does escape.

DNA damage is mostly caused by oxidants. The oxidants in turn arise from both internal and external sources. Internal oxidants come from mitochondria, peroxisomes, cytochrome P450 enzymes, and phagocytic destruction of infected cells. The production of oxidants when infected cells are destroyed may be a factor in the connection between chronic infection and cancer. External sources of oxidants include the nitrogen oxides of tobacco smoke, iron and copper salts, and natural plant phenolics like chlorogenic and caffeic acid.

If oxidants are bad, then antioxidants should be good. They are: antioxidants protect against disease. Natural antioxidants include ascorbic acid (vitamin C) and tocopherol (vitamin E). Synthetic antioxidants are also good. One worker estimated about 5% reduction in cancer because of approved antioxidants added to our food.

The health benefits of antioxidants, provided mostly by fruits and vegetables, are statistically highly significant. The quarter of the US population with the lowest intake of fruits and vegetables has double the cancer rate of the quarter with the highest intake. This applied to “epithelial” cancers (lung, mouth, larynx, oesophagus, stomach, pancreas, cervix, bladder, and colorectal) plus ovarian cancer. Breast and prostate cancer, on the other hand, is less affected by fruit and vegetable diets. (Although there is at least a statistical link between fat/calorie intake and breast cancer.)

Persons taking daily tocopherol or ascorbate had one-third the risk of developing cataracts. In contrast, smoking and radiation (both well known oxidative stresses) are strong risk factors for cataracts. Smoking seems to destroy ascorbate: smokers need to take double or triple amounts of ascorbic acid to achieve the same blood levels as non-smokers. Incidentally, smoking by the father seems to affect sperm production and health; smoking fathers increase the risk of birth defects and childhood cancer in their offspring.

Excess food, at least in rats, is “the most striking rodent carcinogen ever discovered”. Even a 20% increase in calories over the optimal results in shorter life, with more endocrine and mammary tumours.

Excessive cell proliferation (cell division) is a very important factor in cancer production. This has been mentioned above in relation to chronic infection. Major dietary factors, such as salty pickles in the Japanese diet, have been hypothesised to be involved in the high rates of stomach cancer in this population. Even table salt, at high enough concentrations, can cause stomach cancer.

That cell proliferation predisposes to cancer is a major source of false positives in chemical screening as normally carried out. Test chemicals are repeatedly applied to animals at the “MTD” (maximum tolerated dosage). This is like chronic wounding, “which is known to be both a promoter of carcinogenesis in animals and a risk factor for cancer in humans”. Many chemicals that purportedly have caused cancer at high dose (MTD) levels, may therefore not be true carcinogens. The infamous saccharine tests are a case in point: only female mice dosed with nearly toxic levels of saccharine showed an increase in bladder tumours.

For these chemicals that “cause cancer” at high doses only by tissue irritation, a tenfold reduction of dose in a rat or mouse experiment would show much more than a tenfold reduction in risk. This seems to have been confirmed. One analysis of 52 tests showed that two-thirds of the purportedly positive results for carcinogenicity would not have been found if the dosage had been cut even by one-half! (I suspect that commercial cancer-screening laboratories get new contracts in direct relationship to how many “successes” they have had previously.)

(4) How do synthetic and natural chemicals line up as causes of cancer?

The conventional cancer-screening techniques are, as stated above, too sensitive. There are not merely a few chemicals that show up as carcinogenic. Instead, nearly one-half of all chemicals tested seem to be positive in these tests. The ratio is the same for both natural and manmade chemicals, even though very few natural chemicals have been tested. Thus we cannot generalise that natural chemicals are inherently safer or riskier than synthetic chemicals. We must look instead at the quantities of chemicals ingested.

Plants contain surprisingly large quantities of natural pesticides. One of Ames’ greatest achievements, in my opinion, has been to compile convincing evidence about how many natural chemicals have pesticidal functions. (In my youth, the question of the function of different “secondary” plant products was much debated. Some thought that products like alkaloids and lectins were mere accidents of metabolism, a plant process gone wild. I personally thought that the main role of these chemicals was to provide research material for young biochemists.) Ames pointed out that up to 5% of the fresh weight of vegetables can be natural pesticides.

The list is very long, and a sample limited just to non-toxic plants would include: the sharp flavours of mustard and other cabbage-family crops; piperine (10% of weight of black pepper); light-sensitising psoralens in parsnip and celery; chlorogenic and caffeic acid in coffee beans; nerve-poisoning alkaloids in potatoes, tomatoes and eggplants. The cat-attracting chemicals in catnip are actually very good insect repellents. The vast majority of plants are inedible by us. Even so we are at risk of poisoning if cattle or sheep graze on them. Abraham Lincoln’s mother died when she drank milk of cows that had grazed on snakeroot. A California infant was born deformed when fed milk from a goat that had been eating lupin. The concept that “natural is harmless” is simply false.

Ames has published numerous estimates of the amounts of natural pesticides that we eat every day. He calculates that we eat about 10,000 times more natural pesticides than synthetic pesticides. More usefully, he and his coworkers have attempted to estimate the relationship between the amounts of different chemicals we are exposed to, and their potency as carcinogens. After all, it is the dosage that makes the poison, to coin a phrase. Some of his calculations are shown in Table 1, rewritten from Ames et al., 1987. The last column (HERP%) is a relative risk. A 5% HERP doesn’t mean a 5% risk of cancer!

Material Carcinogen, dose to 70kg person Rodent Potency Risk (HERP%)
Tap Water Chloroform, 85 ug 90 0.001*
Contaminated Well water Trichloroethylene, 2800 ug 940 0.004
Home air Formaldehyde, 598 ug 1.5-44 0.6
PCB’s, daily PCB’s 0.2 ug (US average) 1.7-9.6 0.0002*
DDT/DDE, daily DDE, 2.2 ug (US average) 13 0.0003*
Bacon, cooked Nitrosamines, 0.4 ug 0.2 0.003-.006
Peanut butter Aflatoxin, 64 ng/sandwich 0.003 0.03
Brown mustard Allyl isothiocyanate, 5 mg 96 0.07
Mushroom, 1 raw Hydrazines 20-300 0.1
Beer, 350 ml Ethyl alcohol, 18 ml 9110 2.8*
Wine, 250 ml Ethyl alcohol, 30 ml 9110 4.7*
Comfrey-pepsin tablets, 9/day Comfrey root 626 6.2
Diet Cola, 350 ml Saccharin, 95 mg 2143 0.06*
Phenacetin pill Phenacetin, 300 mg 1246-2137 0.3**
Phenobarbital, 1 sleeping pill Phenobaribital, 60 mg 5.5 16***
Formaldehyde, industrial Formaldehyde, 6.1 mg 1.5-44 5.8
EDB, industrial exposure Ethylene dibromide, 150 mg 1.5-5.1 140

Table 1: Calculated risk factors for common chemicals.
* Material not believed to be gene-damaging; that is, acting as a carcinogen only by irritation or damage at high concentrations.
** Some evidence for increased kidney (renal) cancer after long-term use.
*** Apparently no cancer risk to people taking it for decades.

How then do these theoretical risks relate to the “real world”? A few links can be found. There have been perhaps dozens of cases of liver damage from comfrey-pepsin tablets, although this has been as “hepato-occlusive disease” rather than cancer. These comfrey-pepsin tablets have a risk factor (HERP%) of about six.

Although alcohol is a low-potency carcinogen, large quantities are consumed by some people. Alcoholics have significantly increased risk of cancer in the mouth and throat. Thus HERP’s around five seem to be genuine risks. On the other hand, the HERP value of 16 for one phenobarbital sleeping pill is apparently not connected with any risk of cancer. (Note that phenobarbital is one of the numerous so-called carcinogens that shows up as positive only at tissue-irritating concentrations.)

One interesting point is that TCDD (the dreaded “dioxin” of milk cartons and teabags) is known to cause most of its effects by reacting with an animal component called “Ah receptor”. There are chemicals in broccoli, mainly indole-carbinol, that also react with the Ah receptor. Both chemicals can protect against cancer if administered before challenge with a carcinogen. Both chemicals can promote cancer if administered after the carcinogen has already acted.

Taking potency into account, a 100 g portion of broccoli has 20,000 times more effect on the Ah receptor than a legally allowable TCDD intake of six femtograms/kg/day. (Perhaps it is not surprising, then, that experiments in which rats given a carcinogen were protected by including broccoli or cabbage in their diet. There is evidence that humans too are protected by these vegetables: People who are high-crucifer eaters are significantly less likely to wind up in cancer wards.)

(5) How pesticide regulations and chemical scares diminish public health.

Diet is one of the key routes to better health. Only 9% of the US population eats sufficient fruit and vegetables, higher consumption of these would decrease cancer as well as other diseases. There is plenty of margin to increase fruit and vegetable eating.

To discourage consumption of vegetables and fruits is to diminish public health. Excessively strict limits on harmless levels of synthetic pesticides act to increase vegetable and fruit prices, by reducing production and by increasing cost of production. Thus these regulatory restrictions may well be harming health rather than helping it.

Similar comments could be made about the attacks on Alar a few years ago, when apples disappeared from the lunchboxes of many children.

This then is one reason why Bruce Ames is hated by many “environmentalist” groups. He has shown that they are, in all likelihood, damaging public health under the guise of protecting it against non-existent or unimportant risks.

Acknowledgement:

This review was inspired by an article by Dr Arthur B Robinson in Access to Energy, April 1994.

References

B.N. Ames. 1983. Dietary carcinogens and anticarcinogens. Science 221: 1256-1262.

B.N. Ames, R. Magaw, and L.S. Gold. 1987. Ranking possible carcinogenic hazards. Science 236: 271-280.

B.N. Ames and L.S. Gold. 1990. Environmental pollution and cancer: some misconceptions. In: Science and the Law (Ed. Peter Huber).

B.N. Ames and L.S. Gold. 1990. Too many rodent carcinogens: mitogenesis increases mutagenesis. PNAS 87: 7772-7776.

B.N. Ames, M. Profet and L.S. Gold. 1990. Dietary pesticides (99.99% all natural), mitogenesis, mutagenesis, and carcinogenesis. PNAS 87: 7777-7781.

B.N. Ames, M. Profet and L.S. Gold. 1990. Nature’s chemicals and synthetic chemicals: comparative toxicology. PNAS 87: 7782-7786.

B.N. Ames, M.K. Shigenaga and T.M. Hagen. 1993. Oxidants, antioxidants, and the degenerative diseases of aging. PNAS 90: 7915-7922.

B.N. Ames. n.d. Does current cancer risk assessment harm health? Published by The George C Marshall Institute, 1730 M Street, N. W., Suite 502, Washington, D. C. 20036-4505. ($US 5.00) [Not seen by me yet — JDM]

Physical and Financial Health?

On Thursday, 19 August 1993, the Christchurch Press carried a full-page advertisement for the initial New Zealand opening of the “Matrol Opportunity”.

The product, Matrol-Km, was described as “a unique nutritional supplement comprised of a synergistic combination of 13 botanical ingredients that produces an unusually powerful bond at the molecular level”. It was developed over 60 years ago by Dr Karl Jurak (PhD, University of Vienna, 1922), originally for his own use.

We were told that the product “has been tested in the most demanding laboratory in the world — the human body — for over 70 years”. The goal of the company “is not to see how many distributors we can sign up. Our goal is to impact world health. [italics original] Matrol is unique in that its distributors are emotionally tied to its product. They are unwavering in their commitment to use the product daily and reap its health benefits on an ongoing basis. Which means that each distributor is his or her own best testimonial!”

In case the rather vaguely described health advantages of the product weren’t enough, the ad pointed out that Matrol offers “one of the most generous compensation plan[s] in the network marketing industry“. This seems to be 25-40% profits, plus additional 5% commissions on sales made by “supervisors”> under you.

I was intrigued enough by the claims of an unusually powerful molecular bond to attend the evening meeting. Unfortunately the nature of this bond was not mentioned at the meeting, although the herbal ingredients were.

Matrol-Km consists of a dark-coloured, admittedly unpleasant-tasting liquid, which you are supposed to take daily for at least a month to be assured of achieving health effects (although some persons respond inside a day), and which you can then expect to take for the rest of your life. This costs $NZ90 per month per person, unless in self-defense you become a Matrol reseller to obtain wholesale discounts.

The health benefits were not much specified at the meeting. Phrases used included “extra energy”, “better sleep”, “look younger, feel younger”, “clarity of mind”, “an insurance for good health”. I was impressed by the frequency with which speakers talked of having encountered Matrol-Km at financial and/or emotional low-points in their life. We were reminded that the product is for both physical and financial health, and there was to my mind considerable intermingling of the two concepts.

The bottles themselves (one month’s supply, 946 ml), give an admirably thorough list of ingredients, presumably in order of diminishing concentration: water, caramel, potassium citrate, glycerophosphate, calcium glycerophosphate, magnesium glycerophosphate, potassium hydroxide, potassium glycerophosphate, iron glycerophosphate, followed by 13 herbs, plus traces of clove and peppermint oil as flavourings. The mixture, which is non-alcoholic, is preserved by paraben and methyl paraben. Below, I’ve summarised the Matrol claims for each herb as given on a sales pamphlet, and the descriptions given by S. Talalaj and A.S. Czechowicz in their book Herbal Remedies: Harmful and Beneficial Effects.

(1) Chamomile flowers (Matricaria chamomilla).

Matrol: consecrated to the Egyptian Gods; used by Romans for nutritional properties; used to make a tea; high in calcium, magnesium, iron and trace minerals.

T&C: active ingredients are matricine, a volatile oil (1%) containing bisabolols and chamazulene… Also glycosides apigenin, apigetrin, rutin, coumarins, and flavonoids. Pharmacological action: anti-inflammatory, antispasmodic (“cramps”), carminative (anti-farting), sedative, antiseptic, vulnerary (promotes wound healing). A “therapeutically valuable remedy” with mild calming effect useful in treatment of nervous conditions, excitement, and restlessness… Harmless even if taken over a prolonged period.

(2) Saw palmetto berry (sabal, Serenoa repens).

Matrol: N American Indians made tea from berry, which contains many primary nutrients and elemental minerals.

T&C: Active constituents are oestrogen-like steroidal glycosides. Low-toxicity plant, but its use should be discussed with a medical practitioner because of the oestrogen-like effects. Has been used to treat chronic cystitis, might show beneficial effect in treatment of benign enlargement of prostate.

(3) Angelica root (Archangelica officinalis).

Matrol: regarded as holy plant, chewed regularly by Laplanders, rich in essential oils, calcium, vitamin E and vitamin B-12, which is rare in vegetation.

T&C: Active constituents are volatile oil, furanocoumarins, resin, bitter principles, and triterpenoids. Relatively safe in moderate curative doses. (“Fresh root is extremely toxic and is used as a homicidal poison among Canadian Indians.”) Pharmacological action is to increase gastric secretions, antispasmodic, diuretic, sedative. Has mainly been used in treatment of indigestion and flatulent colic… stimulates the appetite in anorexia nervosa, also used for treatment of cystitis and urinary inflammations. Decreases muscular tension and exhibits a mild sedative action….

(4) Thyme (Thymus vulgaris).

Matrol: Signifies graceful elegance in Greece, bravery in European chivalry. Abundant in thiamine, also B-complex, vitamins C and D, and trace minerals.

T&C: Active constituents volatile oil (2-3%)… Also tannins (10%), saponins, flavonoids. Harmless when used in a low dose (oil highly toxic when digested in ml quantities). Pharmacological actions are antiseptic, anthelmintic (intestinal worms), astringent, expectorant, carminative. Has been used in treatment of cough, whooping cough, bronchitis, dyspepsia and stomach disorders, occasionally as anthelmintic.

(5) Passion flower (Passiflora incarnata).

Matrol: cultivated and used by Indians of Virginia (US). Plentiful in nutrient complexes, especially calcium and magnesium.

T&C: Active ingredients indole alkaloids (0.1%) including harmine, harmaline and harman. Also flavonoids, steroidal substances, cyanogenic glycosides and saponins. Harmless if used in a low curative dose, but should only be used under medical supervision. Reputation of being an effective sedative.

(6) Gentian root (Gentiana lutea).

Matrol: popular in Europe as mid-day tea. Rich in B-complex nutrients, vitamin F, niacin, inositol and many trace elements.

T&C: Active constituents are bitter glycosides, also alkaloids, flavonoids, tannins and mucilage. Harmless in low therapeutic doses, but should be avoided in cases of acute gastritis, stomach ulcer, and haemorrhages in gastro-intestinal tract, also by patients with excessive number of red blood cells. Not advisable in breast-feeding women because breast milk may become bitter. Popular bitter gastric stimulant, used as appetizer, to increase gastric secretion in dyspepsia, and to relieve flatulence, also useful for gall-bladder dysfunction and liver problems.

(7) Licorice root (Glycyrrhzia glabra).

Matrol: used anciently in China, Greece. Contains vitamin E, B-complex, biotin, niacin, pantothenic acid, lecithin, manganese and other trace minerals.

T&C: Active constituents are triterpenoid saponins… also flavonoids, oestrogen-like steroids, coumarins, tannins and volatile oil. No adverse effects in low curative doses. Pharmacological action as anti-inflammatory, expectorant (loosens phlegm), anti-spasmodic (cramps), demulcent (eases irritation of skin and lining of digestive tract). Popular remedy mainly for gastric ulcer. Shows beneficial anti-inflammatory effects, reduces gastric acid secretion and promotes ulcer healing. Also used for cough, bronchitis and allergic skin disease.

(8) Senega root (milkwort, Polygala senega).

Matrol: valued by N American Indians for its refreshing mint-like flavour and for many nutrients. Rich in magnesium, iron and other trace minerals.

T&C: Active constituents are triterpenoid saponins (up to 10%) including senegin… Also sterols, resin, and methyl salicylate (oil of wintergreen). Toxic when used in an excessive dose, may cause vomiting diarrhoea, vertigo, visual disturbances, and inflammation of the oesophagus. Should be avoided during pregnancy and G-I inflammation or stomach bleeding. Mainly used to treat cough and chronic bronchitis, often in combination with ipecac, or in combination with other plants as an asthma remedy.

(9) Horehound root (Ballota nigra).

Matrol: member of mint family, praised 4 centuries ago by Gerard for its usefulness. Rich in Vitamins A, E, C, F and B-complex, also contains iron and potassium.

T&C: Active ingredients are flavonoids, “bitter principle” and volatile oil. No adverse effects reported. Used for dyspepsia, flatulence and anti-emetic in pregnancy.

10) Celery seed (Apium graveolens).

Matrol: in use for centuries from Central Europe to East Indies and South America. Seed contains a group of useful organic compounds called phthalides, also vitamins A, B, and C, and iron.

T&C: Active ingredients are volatile oil (3%) containing mainly limonene and selinen, also flavonoid glycoside apiin. A low toxicity plant, but excessive doses should not be used during pregnancy. Mainly used to treat inflammation of urinary tract and cystitis, regarded as an effective urinary antiseptic. Also used to treat arthritis, rheumatism, gout, asthma and bronchitis.

(11) Sarsaparilla root (Smilax officinalis).

Matrol: used by early Americans as “spring tea”. Spanish Conquistadors recorded its [unspecified] legendary qualities. Contains vitamin C and B-complex.

T&C: Active ingredients are steroidal saponins… and parillin. Also tannins, resin and sterols. A low toxicity plant, but excessive dose or prolonged internal use should be avoided. Should not be used in cases of kidney disorder. Pharmacological action is carminative, diuretic, diaphoretic (causing profuse perspiration), antirheumatic. Once had a great reputation in the treatment of rheumatism and skin disease, especially psoriasis.

(12) Alfalfa (Medicago sativa).

Matrol: revered by ancients as “King of Plants”, an excellent source of easily assimilated vitamins and minerals. Contains 14 of the 16 principal mineral elements and all known vitamins, but is especially rich in some amino acids and vitamins A, D and K, and iron.

T&C: Active constituents are oestrogen-like isoflavonoids, alkaloids, carotenoids (provitamin A), and vitamins B1, B2, K, C and D. Also coumarins and mineral salts of calcium, potassium, iron and phosphorus. Excessive doses taken internally can cause flatulence and diarrhoea. Long term application can produce reactivation of systemic lupus erythematosus and produce skin ulceration. Excessive doses can also produce an oestrogen-like response. Pharmacological action as anti-anaemic, nutritive. Mainly used as a nutrient for convalescent patients.

Note that this is just about the only case where the Matrol literature agrees with Talalaj and Czechowicz.

(13) Dandelion root (Taraxacum officinale).

Matrol: Rich in vitamin complexes, choline, a B-vitamin, and a main component of lecithin. Also contains vitamins A and C, and essential linolenic acid.

T&C: Active ingredients are taraxacin, inulin (a fructose polymer), potassium salts, and vitamin A. Harmless. Used for liver ailments and gallstones.

The remarkable thing about the Matrol descriptions is that they concentrate, rather boringly, on the mineral and vitamin contents of their herbal ingredients.

Minerals and vitamins are easily obtained, in relatively cheap multi-purpose vitamin pills, if not in our ordinary diet. In any case, Matrol-Km must contain more potassium, magnesium, calcium, and iron in the form of a glycerophosphate complex than would be contributed by the tinier amounts of herbs. What is special about herbs is their content of pharmacologically active ingredients. I would be flabbergasted if the grossly impure (oops, “complexly formulated”) mixture of chemicals in a given herb is optimal for a particular treatment.

Why doesn’t the Matrol literature mention the pharmacology of their herbal ingredients? Perhaps that would amount to making medical claims. Does Matrol-Km contain enough herbal content to have a pharmacological effect? If so, the foregoing list suggests there could be something beneficial for everyone, although the bitter stomach-stimulating actions of gentian would seem to be fighting the stomach-soothing actions of licorice.

One might be concerned at the oestrogen-like properties of a number of ingredients. Since oestrogens are used in hormone-replacement therapy for menopausal women, could this account for some of the beneficial effects of Matrol-Km? Is it safe for a man to take it? Where is the medical study that shows this mixture is safe for lifelong ingestion? (I’m not even asking for evidence about efficacy!)

After studying the list of ingredients, I’m personally convinced that the original mixture of Dr Jurak might have been useful. In fact I’m going to pick up most of the herbal remedies at the health-food section of the supermarket next week, just to have on hand as cheap try-it-and-see remedies in case mild episodes of the pertinent illnesses arise, say, on a weekend.

I dare say it will cost far less than $90, and I’ll use just the herbs that seem appropriate to a given requirement rather than a shot-gun mixture.